In the ever-evolving world of digital marketing, staying on top of trends is non-negotiable. Google Ads Benchmarks 2025 offer a data-driven foundation for marketers and businesses to evaluate the effectiveness of their campaigns. These benchmarks provide average performance metrics—like click-through rates (CTR), cost per click (CPC), and conversion rates (CVR)—across various industries, helping advertisers set realistic goals and identify areas for improvement. Whether you’re in e-commerce, real estate, or B2B services, these insights are essential for making informed, competitive ad strategy decisions this year.
Google Ads Benchmarks 2025: Key Metrics Across Industries
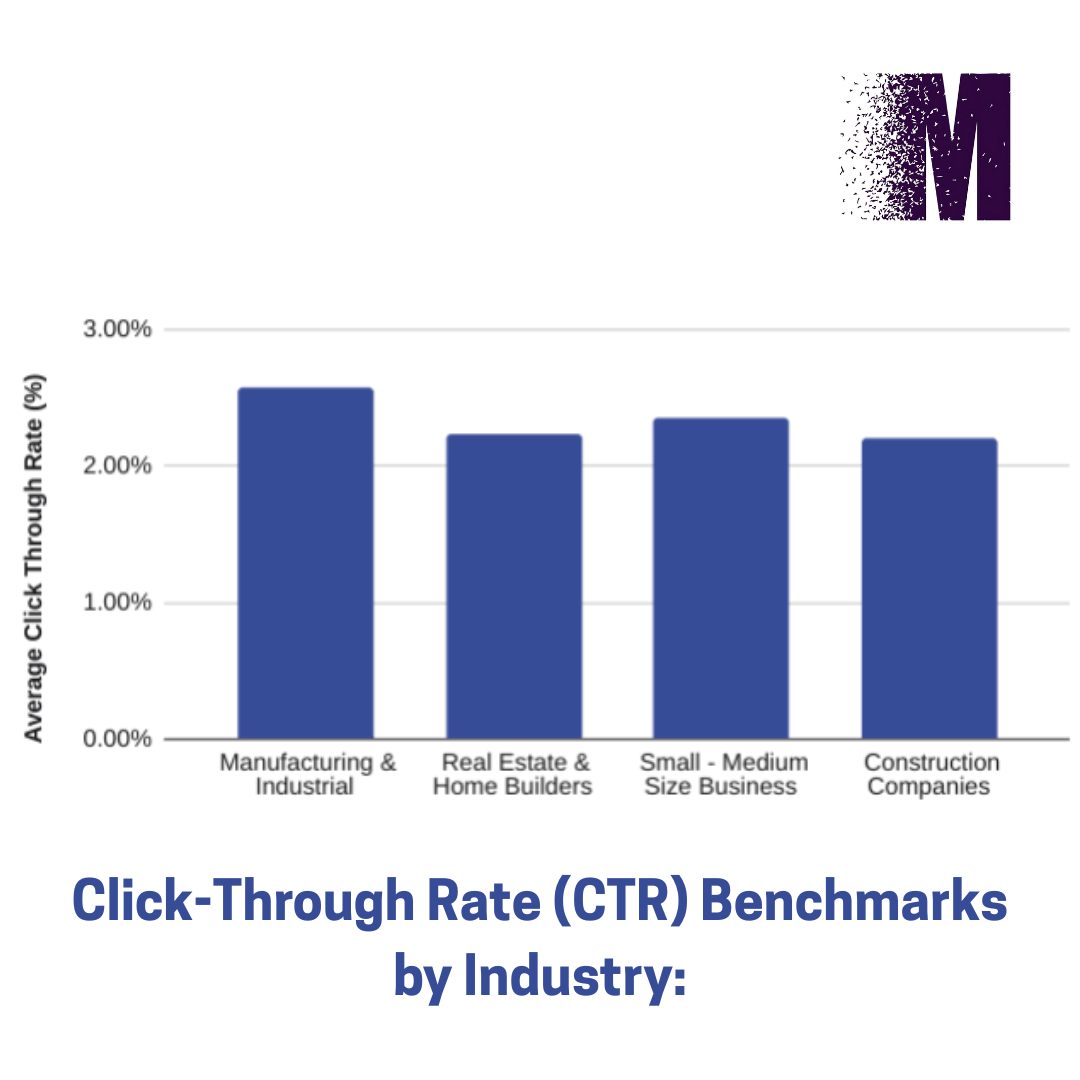
One of the most telling indicators of ad performance is the Click-Through Rate (CTR). In Google Ads Benchmarks 2025, CTR reveals how effective your ad copy and targeting are at attracting users to click. A higher CTR often correlates with better ad relevance and engagement.
Click-Through Rate (CTR) Benchmarks by Industry:
- Travel & Hospitality – 10.0%
This sector leads the pack, showing that consumers are actively engaging with ads promoting travel experiences, likely due to post-pandemic rebound and seasonal demand. - Automotive – 8.8%
Strong interest in vehicles and auto services continues to drive high click activity, especially for localized dealership campaigns and electric vehicle promotions. - Real Estate – 8.9%
Real estate ads benefit from visually appealing formats and urgent buyer behavior, maintaining a competitive CTR. - Education – 6.4%
Educational services see moderate engagement as users research programs and institutions, particularly in online learning. - Legal Services – 4.8%
Though CTR is lower in this high-stakes industry, it reflects a more selective click behavior where users are cautious and intentional.
Tracking these CTR benchmarks across industries helps advertisers understand where they stand and how they can refine their messaging and targeting to boost performance in 2025.

Google Ads Benchmarks 2025: Cost Per Click (CPC) Benchmarks
Cost Per Click (CPC) is a crucial metric that directly affects your ad budget and ROI. It represents how much you’re paying on average for each click on your ad. The Google Ads Benchmarks 2025 reveal significant variation across industries, highlighting how competition and customer value influence ad costs.
Read More Blogs: 101 SEO Stats to Reference Everywhere in 2025
Cost Per Click (CPC) Benchmarks by Industry:
- Legal Services – $9.21
As one of the most competitive and high-value sectors, legal ads demand a premium CPC, reflecting the potential long-term value of each client acquired. - Home Services – $6.55
With rising demand in areas like plumbing, HVAC, and renovations, home service businesses face increased bidding competition in 2025. - B2B Services – $5.47
B2B advertisers see higher CPCs due to niche targeting and typically longer sales cycles, where clicks often lead to high-value conversions. - Education – $4.10
Moderate CPCs make education one of the more accessible industries to advertise in, with a growing focus on online courses and certifications. - Real Estate – $1.55
Surprisingly low CPCs in real estate suggest a strategic opportunity for advertisers to capture high-intent leads at a lower cost.
Understanding CPC trends in the Google Ads Benchmarks 2025 can help you manage your ad spend more efficiently and ensure you’re getting the most out of your budget in a competitive digital landscape.
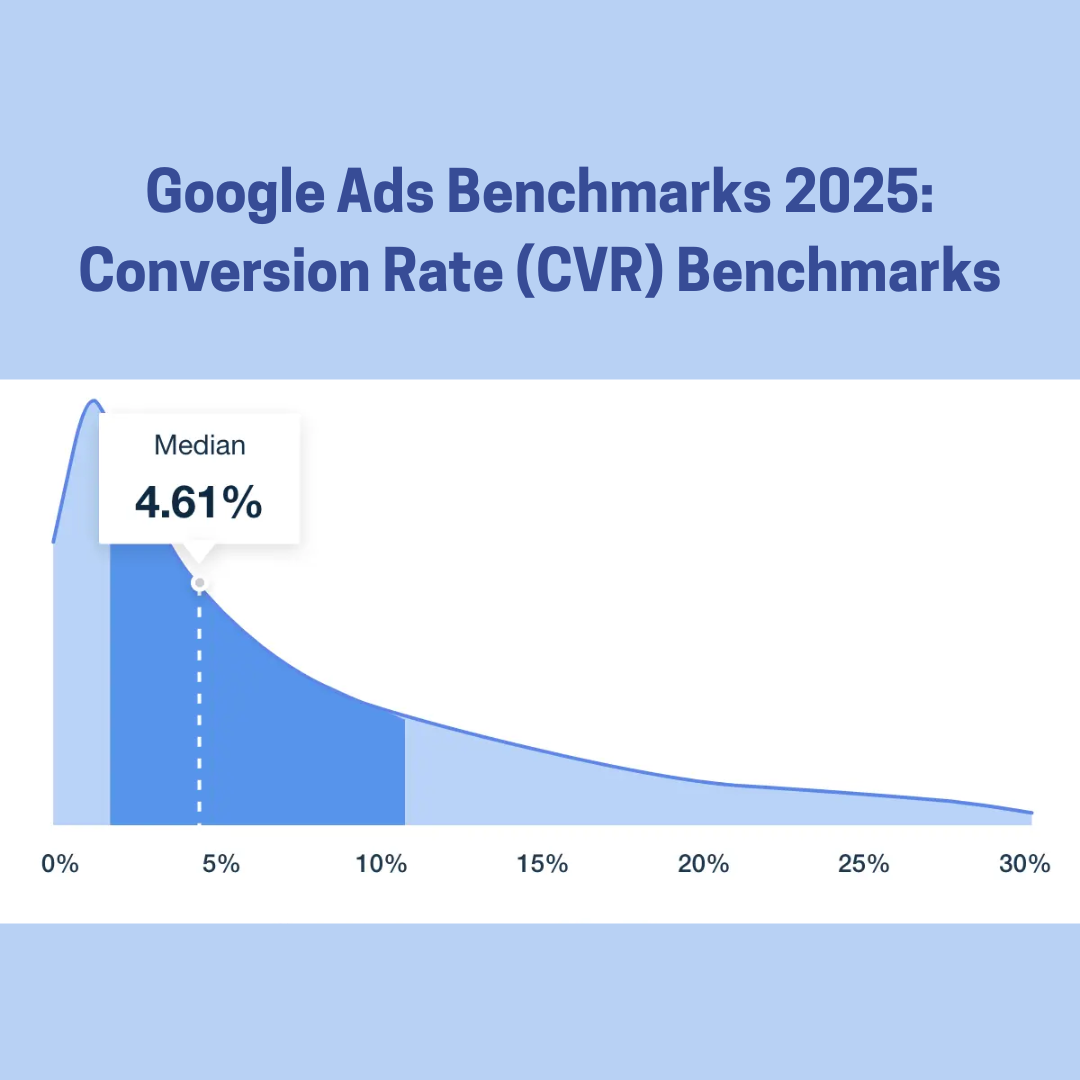
Google Ads Benchmarks 2025: Conversion Rate (CVR) Benchmarks
Conversion Rate (CVR) is one of the most critical metrics in digital advertising—it shows the percentage of ad clicks that turn into valuable actions like purchases, sign-ups, or inquiries. High conversion rates often indicate well-optimized landing pages, strong offers, and audience relevance. The Google Ads Benchmarks 2025 highlight how industries vary in their ability to turn traffic into results.
Read More Blogs: Boost Content Performance: 11 Proven Tips
Conversion Rate (CVR) Benchmarks by Industry:
- Home Services – 10.2%
This sector tops the list, as consumers searching for urgent repairs or maintenance tend to convert quickly once they find the right provider. - Health & Fitness – 8.4%
With growing health awareness, this industry benefits from strong user intent and compelling offers like free trials or consultations. - Legal Services – 7.0%
Despite a high CPC, legal services maintain solid conversion rates due to the serious and immediate nature of user intent. - Education – 7.1%
Education providers are seeing strong conversion rates as users actively seek learning opportunities, particularly in digital and career-advancing programs. - Real Estate – 2.9%
Real estate conversions are naturally lower due to longer decision-making processes and higher financial commitments.
By analyzing Google Ads Benchmarks 2025 CVR data, advertisers can identify how effectively their campaigns are driving real business results—and where they may need to improve user experience or messaging to close more conversions.
Google Ads Benchmarks 2025: Conversion Rate (CVR) Benchmarks
Conversion Rate (CVR) tracks how efficiently your ads turn clicks into tangible actions—whether that’s a sale, form submission, or consultation booking. As revealed in the Google Ads Benchmarks 2025, conversion performance varies greatly by industry due to factors like customer intent, sales cycle length, and service urgency.

Conversion Rate (CVR) Benchmarks by Industry:
- Home Services – 10.2%
Leading the chart, this sector sees high conversions as users typically search with immediate intent, such as fixing a leak or installing an appliance. - Health & Fitness – 8.4%
With increased interest in personal well-being, offers like fitness memberships, supplements, and online coaching are converting at a strong rate. - Education – 7.1%
Prospective students are actively enrolling in online courses and training programs, especially in tech, business, and certification-focused niches. - Legal Services – 7.0%
Even with a high cost per click, legal services see consistent conversions as users searching for attorneys often have pressing legal needs. - Real Estate – 2.9%
While interest is high, the long consideration phase and high financial commitment mean fewer clicks lead to immediate conversions.
For marketers aiming to improve campaign ROI, benchmarking your current CVR against these Google Ads Benchmarks 2025 can reveal whether your ads are driving action—or simply attracting clicks.
Google Ads Benchmarks 2025: Cost Per Acquisition (CPA) Benchmarks
Cost Per Acquisition (CPA) is the average amount you spend to convert a user into a customer or lead. It’s one of the most important metrics for understanding the efficiency of your ad spend. The Google Ads Benchmarks 2025 highlight how much different industries are investing to secure new business through paid search.
Cost Per Acquisition (CPA) Benchmarks by Industry:
- B2B Services – $116.00
With longer sales cycles and higher customer lifetime values, B2B companies typically accept higher CPAs in exchange for quality leads.Legal Services – $86.00
Though expensive, the high-value nature of legal clients justifies a larger acquisition cost, especially in competitive niches like personal injury or criminal law. - Education – $72.70
Education providers invest moderately in acquiring students, especially as online learning platforms compete for attention in a crowded digital space. - Real Estate – $116.60
Matching B2B, real estate leads are costly to acquire due to the high stakes and complex sales process—but the potential commission makes it worthwhile. - Travel & Hospitality – $44.70
More affordable compared to other sectors, travel businesses benefit from seasonal demand and impulsive booking behavior that keeps CPA lower.
Monitoring your CPA against the Google Ads Benchmarks 2025 ensures your acquisition strategy is cost-effective and helps you decide where to adjust targeting, offers, or creative to improve your return on ad spend.
Google Ads Benchmarks 2025: Return on Ad Spend (ROAS) Benchmarks
Return on Ad Spend (ROAS) is a key performance metric that tells you how much revenue you earn for every dollar you invest in advertising. A higher ROAS means your campaigns are generating more value for your budget. According to the Google Ads Benchmarks 2025, industries vary widely in how efficiently they convert ad spend into revenue.
Return on Ad Spend (ROAS) Benchmarks by Industry:
- Automotive Parts – 7.36
This industry leads in ROAS, thanks to high consumer demand and cost-effective product listings that drive profitable returns. - Baby Care – 5.96
Baby care brands perform strongly as loyal customer behavior and subscription-based products help generate consistent returns on ad investments. - Food – 5.13
Quick purchase cycles and emotional buying tendencies make food a high-performing vertical with healthy returns. - Furniture – 4.50
Though larger purchases take more consideration, effective retargeting and visual ads help furniture brands maintain solid ROAS. - Beauty – 3.05
Competitive but strong, the beauty industry relies on brand loyalty and influencer marketing to sustain a steady ROAS.
Tracking these industry-specific Google Ads Benchmarks 2025 helps you assess whether your campaigns are profitable—and where to optimize bidding strategies, creatives, or funnel stages to improve performance and scale your results.
Google Ads Benchmarks 2025: Automotive Industry Insights
The automotive industry continues to be a high-performing sector in digital advertising, combining strong user intent with competitive ad strategies. Based on the Google Ads Benchmarks 2025, here’s how this industry is performing across key metrics:
- Click-Through Rate (CTR) – 8.8%
Automotive ads maintain an impressive CTR, reflecting high consumer interest in both new and used vehicles, especially for localized dealership campaigns. - Cost Per Click (CPC) – $2.08
A relatively moderate CPC makes it cost-effective for advertisers to drive substantial traffic while maintaining healthy margins. - Conversion Rate (CVR) – 5.7%
With a strong CVR, automotive ads are effectively turning interest into action—whether it’s booking test drives, exploring financing, or contacting dealerships. - Cost Per Acquisition (CPA) – $33.50
This low-to-moderate CPA highlights the industry’s efficiency in converting leads, particularly when campaigns are optimized for local search and mobile users.
If you’re marketing in the automotive space, these Google Ads Benchmarks 2025 show a strong potential for ROI—especially if you align your campaigns with consumer intent, optimize your landing pages, and leverage dynamic inventory ads.
Google Ads Benchmarks 2025: Legal Services Industry Insights
The legal services industry is one of the most competitive sectors in Google Ads, with high stakes and high customer value. According to the Google Ads Benchmarks 2025, performance metrics reflect the cost of visibility and the potential for substantial return when campaigns are well-targeted and optimized.
- Click-Through Rate (CTR) – 4.8%
A lower CTR is typical for legal ads, as users tend to be more cautious and deliberate when engaging with legal services. - Cost Per Click (CPC) – $9.21
One of the highest CPCs across all industries, legal ads are costly due to intense competition for high-intent keywords like “personal injury lawyer” or “criminal defense attorney.” - Conversion Rate (CVR) – 7.0%
Despite a lower CTR, the high CVR indicates that those who do click are serious prospects actively seeking legal help. - Cost Per Acquisition (CPA) – $86.00
The CPA is substantial, but justified by the lifetime value of a legal client—making each conversion a valuable win.
For law firms and legal marketers, these Google Ads Benchmarks 2025 emphasize the need for precision targeting, compelling copy, and optimized landing pages to make the most of every high-cost click.

Google Ads Benchmarks 2025: Education Sector Insights
The education sector continues to evolve rapidly, driven by growing demand for online courses, certifications, and degree programs. The Google Ads Benchmarks 2025 reveal how this industry is performing in terms of key advertising metrics:
- Click-Through Rate (CTR) – 6.4%
A solid CTR reflects strong interest from prospective students actively researching educational opportunities. - Cost Per Click (CPC) – $4.10
Moderate CPC levels make education advertising accessible, balancing competition with affordability. - Conversion Rate (CVR) – 7.1%
High conversion rates suggest that education ads are effectively turning clicks into applications, registrations, or inquiries. - Cost Per Acquisition (CPA) – $72.70
Although acquiring new students can be costly, this CPA is reasonable given the long-term value of an enrolled student.
For educational institutions and course providers, these Google Ads Benchmarks 2025 highlight the importance of targeted messaging, clear calls to action, and seamless user experiences to maximize enrollment and engagement.
Optimizing Your Google Ads Campaigns in 2025
To make the most of the Google Ads Benchmarks 2025, it’s essential to continuously evaluate and refine your campaigns. Here’s a simple framework to help you optimize and boost your ad performance:
- Compare: Start by assessing your current campaign metrics against the industry benchmarks. This will help you understand where you stand and set realistic goals.
- Identify: Look closely at areas where your campaigns are underperforming, whether it’s low CTR, high CPC, or poor conversion rates.
- Optimize: Use these insights to adjust your ad copy, refine your audience targeting, and fine-tune your bidding strategies to better align with your objectives.
- Test: Implement A/B testing regularly to discover which creatives, headlines, and calls to action resonate most effectively with your audience.
By aligning your strategies with the Google Ads Benchmarks 2025, you can enhance campaign efficiency, improve engagement, and ultimately achieve a stronger return on ad spend (ROAS). Consistent optimization is key to staying competitive in today’s dynamic advertising landscape.
Conclusion: Harnessing Google Ads Benchmarks 2025 for Success
Staying informed about the Google Ads Benchmarks 2025 empowers advertisers to make smarter, data-driven decisions that boost both effectiveness and efficiency. By regularly reviewing your campaign performance against these industry standards, you can quickly identify opportunities for improvement and adapt to changing market dynamics.
Consistently aligning your strategies with these benchmarks is essential to maintaining a competitive edge in the fast-paced digital marketplace of 2025. This proactive approach ensures your Google Ads campaigns deliver maximum impact and optimal return on investment.

